Replication Codes - When is the Long Run? Historical Time and Adjustment Periods in Demand-led Growth Models
in Codes Last modified at:

Online Appendix of the Paper When is the Long Run? Historical Time and Adjustment Periods in Demand-led Growth Models
Online Appendix
Here you can find the Online Appendix of the paper When is the Long Run? Historical Time and Adjustment Periods in Demand-led Growth Models.
Pre-print
A pre-print is available as a New School Working Paper here
R code
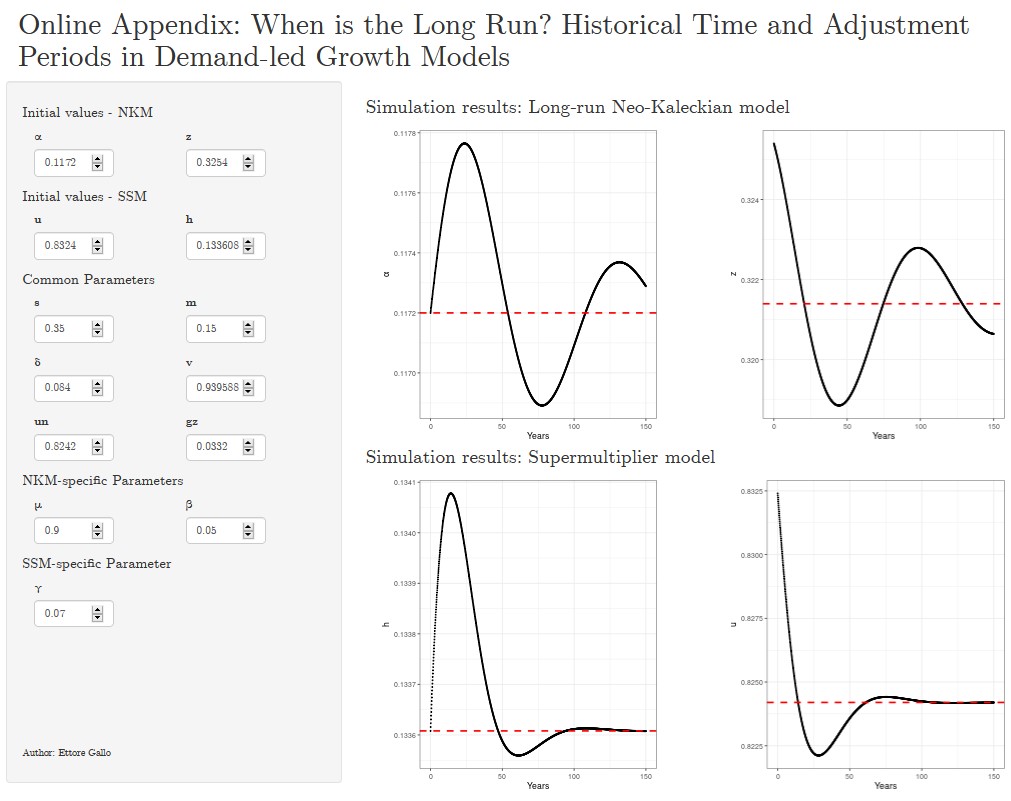
Here is the code to generate the app:
// file: 'long_run.r'
library(shinydashboard)
library("deSolve")
library(ggplot2)
library(shinyjs)

jscode <- "shinyjs.refresh = function() { history.go(0); }"

### PARAMETER CALIBRARION ####
s = 0.5
m = 0.17
un = 0.8242
v = 0.989
gz = 0.025

beta = 0.25 #689
gammau = 0.15
delta = 0.084

#LAVOIE EQUILIBRIUM
alfaeq = gz + delta
zeq = (s+m)*un/v-gz-delta
s+m - beta*v #Stability condition
((s+m)*un)/(gz*v)-1 ## Stability condition for mu

mu = 0.18  #0.4*zeq

gz0 = gz + .01

#SERRANO EQUILIBRIUM and Stability
heq = v*(gz+delta)/un

##INITIAL CONDITIONS
u1 = un
z1 = ((s+m)/v-beta)*u1+beta*un-alfaeq

### stability and eigenvalues - Supermultiplier
A_SSM = matrix(c(0, gammau*v*(gz0+delta)/un,
                 -un^2/v, (gz0+delta)*(gammau*v)/(s+m-v*(gz0+delta)/un-1)),
               2,2, byrow=TRUE)
A_SSM

TrA_SSM <- A_SSM[1,1]+ A_SSM[2,2]
TrA_SSM <- (gz0+delta)*(gammau*v)/(s+m-v*(gz0+delta)/un-1)
TrA_SSM

DetA_SSM <- A_SSM[1,1]*A_SSM[2,2]-A_SSM[2,1]*A_SSM[1,2]
DetA_SSM
DetA_SSM <- gammau*un*(gz0+delta)

ev_SSM <- eigen(A_SSM)
# extract components
(values <- ev_SSM$values)
(vectors <- ev_SSM$vectors)

### stability and eigenvalues - Supermultiplier
A_NKM = matrix(c(beta*v*mu/(s+m-beta*v), beta*v*mu/(s+m-beta*v),
                 -((s+m)*un/v-gz0-delta)*(1+beta*v/(s+m-beta*v)), -beta*v/(s+m-beta*v)*((s+m)*un/v-gz0-delta)
                 ),
               2,2, byrow=TRUE)
A_NKM

TrA_NKM <- A_NKM[1,1]+ A_NKM[2,2]
TrA_NKM <- beta*v/(s+m-beta*v)*(mu-(s+m)*un/v+gz0+delta)
TrA_NKM

DetA_NKM <- A_NKM[1,1]*A_NKM[2,2]-A_NKM[2,1]*A_NKM[1,2]
DetA_NKM
DetA_NKM <- beta*v*mu/(s+m-beta*v)*((s+m)*un/v-gz0-delta)

ev_NKM <- eigen(A_NKM)
# extract components
(values <- ev_NKM$values)
(vectors <- ev_NKM$vectors)


lavoie <- function(t, y, p) {
  with(as.list(c(y, p)), {
    dα = μ*β*(((α+z)*v-(s+m)*un)/(s+m - β*v))
    dz = z*(gz-α-β*(((α+z)*v-(s+m)*un)/(s + m - β*v))+delta)
    list(c(α=dα, z=dz))
  })
}


SSM <- function(t, y, p) {
  with(as.list(c(y, p)), {
    dh = h*γ*(u-un)
    du = u*(gz + delta + h*γ*(u-un)/(s+m-h)-(u*h)/v)
    list(c(h=dh, u=du))
  })
}

## UI ####
ui <- fluidPage(
  tags$head(tags$style(
    HTML('
         #sidebar {

        }

        body, label, input, button, select {
          font-family: "CMU Serif";
        }')
  )),
  headerPanel("Online Appendix: When is the Long Run? Historical Time and Adjustment Periods in Demand-led Growth Models"),
  sidebarLayout(fluid=T,
                sidebarPanel(id="sidebar",
                             h4("Initial values - NKM"),
                             column(6,
                                    numericInput("α", label = "α",
                                                 min = 0.01, max = 0.5, value = alfaeq, step = 0.0005, width=100)),
                             column(6,
                                    numericInput("z", label = "z",
                                                 min = 0.01, max = 0.7,  value = round(zeq, digits = 4), step = 0.01, width=100)),
                             h4("Initial values - SSM"),
                             column(6,
                                    numericInput("u", label = "u",
                                                 min = 0.5, max = 1, value = round(un, digits = 4), step = 0.01, width=100)),
                             column(6,
                                    numericInput("h", label = "h",
                                                 min = 0.01, max = 0.35,  value = round(heq, digits = 4), step = 0.01, width=100)),
                             h4("Common Parameters"),
                             column(6, numericInput("s", label = "s",
                                                    min = 0.2, max = 0.6,  value = s, step = 0.025, width=100)), ## FAZZARI
                             column(6, numericInput("m", label = "m",
                                                    min = 0.0, max = 0.5,  value = m, step = 0.025, width=100)),
                             column(6, numericInput("delta", label = "δ",
                                                    min = 0.01, max = 0.2, value = delta, step = 0.01, width=100)),
                             column(6, numericInput("v", label = "v",
                                                    min = 0.5, max = 3, value = v, step = 0.025, width=100)),
                             column(6, numericInput("un", label = "un",
                                                    min = 0.5, max = 1, value = un, step = 0.05, width=100)),
                             column(6, numericInput("gz", label = "gz",
                                                    min = 0.01, max = 0.12, value = gz0, step = 0.005, width=100)),
                             h4("NKM-specific Parameters"),
                             column(6, numericInput("μ", label = "μ",
                                                    min = 0.01, max = 1, value = round(mu, digits = 4), step = 0.01, width=100)),
                             column(6, numericInput("β", label = "β",
                                                    min = 0.01, max = 1, value = beta, step = 0.01, width=100)),
                             h4("SSM-specific Parameter"),
                             column(6, numericInput("γ", label = "γ",
                                                    min = 0.01, max = 1, value = gammau, step = 0.01, width=100)),
                             tags$br(),
                             tags$br(),
                             tags$br(),
                             tags$br(),
                             tags$br(),
                             tags$br(),
                             tags$br(),
                             tags$br(),
                             tags$br(),
                             tags$br(),
                             h6("Author: Ettore Gallo")
                             # h4("."),
                             # h4("."),
                             # h4(".")

                ),
                mainPanel(
                  h3("Simulation results: Long-run Neo-Kaleckian model"),
                  column(6,
                         plotOutput("lavoie_plot1")),
                  column(6,
                         plotOutput("lavoie_plot2")),
                  h3("Simulation results: Supermultiplier model"),
                  column(6,
                         plotOutput("SSM_plot1")),
                  column(6,
                         plotOutput("SSM_plot2"))
                )
  ))


server <- function(input, output, session) {
  output$lavoie_plot1 <- renderPlot({
    y0 <- c(α=input$α, z=input$z)
    parms <- c(s=input$s, m=input$m,
               μ=input$μ, β=input$β, delta=input$delta, v=input$v, un=input$un,gz=input$gz)
    times <- seq(0, 100, .05)
    out <- ode(y0, times, lavoie, parms)
    par(mfrow=c(1, 2))
    ggplot(data = as.data.frame(out), aes(time, α)) + geom_point(size = 0.5) + geom_hline(yintercept=input$gz+input$delta, linetype="dashed",
                                                                                          color = "red", size=1) + xlab("Years") +theme_bw()
  })
  output$lavoie_plot2 <- renderPlot({
    y0 <- c(α=input$α, z=input$z)
    parms <- c(s=input$s, m=input$m, delta=input$delta,
               μ=input$μ, β=input$β, v=input$v, un=input$un,gz=input$gz)
    times <- seq(0, 100, .05)
    out <- ode(y0, times, lavoie, parms)
    par(mfrow=c(1, 2))
    ggplot(data = as.data.frame(out), aes(time, z)) + geom_point(size = 0.5) + geom_hline(yintercept=((input$s+input$m)*input$un/input$v-input$gz-input$delta)
                                                                                          , linetype="dashed",
                                                                                          color = "red", size=1)+theme_bw()+ xlab("Years")
  })
  output$SSM_plot1 <- renderPlot({
    y02 <- c(h=input$h, u=input$u)
    parms2 <- c(γ=input$γ, un=input$un,delta=input$delta,
                 gz=input$gz, s=input$s, m=input$m, v=input$v)
    times2 <- seq(0, 100, .05)
    out2 <- ode(y02, times2, SSM, parms2)
    par(mfrow=c(1, 2))
    ggplot(data = as.data.frame(out2), aes(time, h)) + geom_point(size = 0.5) + geom_hline(yintercept=(input$gz+input$delta)*input$v/input$un, linetype="dashed",
                                                                                           color = "red", size=1)+theme_bw()+ xlab("Years")
  })

  output$SSM_plot2 <- renderPlot({
    y02 <- c(h=input$h, u=input$u)
    parms2 <- c(un=input$un, γ=input$γ,delta=input$delta,
                gz=input$gz, s=input$s, m=input$m, v=input$v)
    times2 <- seq(0, 100, .05)
    out2 <- ode(y02, times2, SSM, parms2)
    par(mfrow=c(1, 2))
    ggplot(data = as.data.frame(out2), aes(time, u)) + geom_point(size = 0.5) + geom_hline(yintercept=input$un, linetype="dashed",
                                                                                           color = "red", size=1)+theme_bw()+ xlab("Years")
  })
}

shinyApp(ui, server)
Slides
Slides here.
